 Index
Index

Calorie Restriction Extends Life
The graph above shows the life extension effect of various degrees of Calorie Restriction (CR) on mice. Since
reduced calorie diets were found to increase the longevity of mice in 1935, hundreds of other
experiments have shown that CR
is effective in extending the lifespan of many species ranging from microscopic yeasts to monkeys.
A limited number of human experiments have provided tantalizing evidence that CR may also
help humans live longer.

Dr. Roy Walford was an early researcher in calorie restriction and a participant in the Biosphere experiment which was a closed, self-sustaining system simulating a station for space colonization. Due to the inability to grow enough food, the residents of the Biosphere had to eat restricted calorie diets that over the 2-year span of the experiment reduced their metabolism and improved some of their biomarkers of aging, although the living conditions were very stressful. Dr. Walford wrote several books on calorie restriction, including Beyond the 120 Year Diet : How to Double Your Vital Years. Dr. Walford's books influenced many people interested in longevity to start Calorie Restricted diets with Optimum Nutrition (CRON). The mice longevity chart illustrated above is featured prominently in the web site of the CR Society International whose mission is to promote the Calorie Restriction diet and information about practicing CR. The mouse experiments show that a 40% CR diet can increase the maximum life span by about 30%. If applicable to humans, such a life extension would mean the difference between living to an age of 104 instead of just 80.
What Level of CR is Harmful?
Over the years, aggressive practitioners of CR have reported lower bone densities and
even osteoporosis. As a result, some of them have increased their food consumption,
improved their nutrition, or started taking bone-building medications like strontium,
bisphosphonates, or Forteo (teriparatide). One of the problems in practicing CR
has been that, until the development of the Calorie Restriction Calculator,
there was no generalized objective way of measuring the Percent of Calorie Restriction for humans because controls
are not available like for the animal experiments. Dr. Walford recommended losing weight until a
Body Mass Index (BMI) of less than 20 is reached [1, p.228],
but it has always been difficult to determine the number of calories that can sustain the
corresponding weight because the degree of physical activity affects the results.
The mantra has been "fewer calories more life", but without metrics it is easy to overdo it.
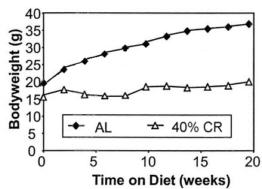
The chart below from Mattson [2] compares the growth of mice restricted by 40% and their controls. The chart establishes that 40% CR stops the growth of the rodents and allows them to reach a mature weight which is only one half as much as the controls. This stunting effect has great implications for the maintenance of high degrees of human CR. This growth chart is very important and deserves as much emphasis as the longevity chart because it establishes the relationship between nutrition and body weight.
|
|
Body weights of male C57BL/6 mice. (Derived from Mattson [2]) |
Learning from the Rodent Data
Mattson [2] and Masoro [3] have found that rodents restricted by 40%
have adult weights which are approximately half of the controls.
Assuming that the relationship between CR and weight is linear, we can use the two points
(0.0 CR, 1.0 WT) and (0.40 CR, 0.5 WT)
to derive the following equation and its corresponding graph:

By applying the mouse data to humans, we can get a graphic that illustrates the corresponding relative weights of humans at different levels of caloric restriction. Of course, this is speculative and assumes that calorie restriction was started early in life and the body could maintain its proportions while developing to the limit sustained by the nutrients. If a control human weighed 150 pounds (68 kg), the 40% CR human would weigh 75 pounds (34 kg). Using human growth charts, we can estimate that the human control would be approximately 69 inches (175 cm) high, and the 40% CR human would be 57 inches (145 cm) tall.

Using the Mifflin-St Jeor Energy Equations
The extrapolation of rodent results to humans is an interesting theoretical exercise, but
it would be more convincing to get corroborating evidence from a model developed for humans.
Here, we will use the Mifflin-St Jeor equations to estimate the relationship of
body weight and calories.[4] The Mifflin-St Jeor equations are commonly used to estimate
caloric requirements in a variety of clinical situations. The equations calculate
the Basal Metabolic Rate (BMR) or Resting Metabolic Rate (RMR) in Calories using the weight in
kilograms, the height in centimeters, and the age in years:
If we allow the age to remain constant, we can get a function with only BMR and weight as variables if we use the formula for Body Mass Index (BMI) and make the height dependent on the weight. For this, we can assume a BMI of 22 which is the middle of the normal range:
Substituting in the equation for male, we get:
By setting the age to 35, we can build the following table with the weight in pounds, the height in inches, and the BMR in Calories:

If we take the top entries as reference (W0 and BMR0), we can plot the Relative Weight, Wi/W0, against the Relative BMR, (BMR0-BMRi)/BMR0. The graph is virtually indistinguishable from the graph created from the mouse data. The Mifflin-St Jeor equation for females produces a very similar graph, but with the Relative BMR values about 5% higher.

The fact that we can use equations developed for humans to map to the results obtained for rodents is very strong evidence that similar limiting mechanisms between nutrition and body weight may be involved for different species.
Losing weight in Adulthood
Human CR is generally started in adulthood, and this has some interesting implications about how
the body is restructured when fewer nutrients are available. Loss of weight in adulthood
does not result in a three-dimensional geometric shrinking that keeps the same proportions of the body.
Bones have a high mineral content, and although they contain a substantial amount of
metabolically active tissue, they are not easily resized. This means that weight loss due to
caloric restriction will start by eliminating muscles and fat while the size of the bones remains
basically unaffected. The maintenance of height accompanied by the loss of weight can be monitored using
the Body Mass Index.
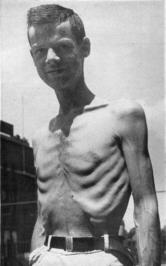
Acute undernutrition produces emaciated bodies like those of the
World War 2 concentration camps or Keys' Minnesota experiment (right).
Chronic undernutrition eventually will decrease the bone mass and may produce clinical conditions
like osteoporosis and its consequences such as kyphosis which are common in patients with
anorexia nervosa.
Maximum Safe Percent CR
A BMI below 17.5 is one of the criteria used for diagnosing anorexia nervosa.[6] If we set this
BMI as the lower limit for sustainable Calorie Restriction, we can determine the corresponding degree of CR
by using the BMI formula and mapping the weight ratio using the chart above. As an example, let us
consider a person who is 6 feet (183 cm) tall. Using the BMI equation with BMI 22, we
calculate that the "normal" weight should be 162 pounds (73.7 kg). A BMI of 22 serves as a good reference point
because it is in the middle of the normal BMI range (18.5 to 24.9).
A BMI of 17.5 for the 6-foot person corresponds to a weight of 129 pounds (58.6 kg).
The ratio of the weights 129/162 is 0.8 which on the chart corresponds to approximately 16 percent CR.
This percentage is a function of the ratios of the BMIs 22 vs 17.5, so regardless of a person's height,
the maximum percentage of Caloric Restriction turns out to be around 16 percent.
The resting metabolic rate per kilogram of metabolically active tissue has been reported to decrease in semistarvation studies by 16% as a biologically survival mechanism.[7] This metabolic adaptation may make it possible to practice 16% calorie restriction without significant loss of weight. Restricting calories beyond the ability of the metabolism to compensate will result in weight loss. A reduction of BMI from 22 to 20 will decrease the number of calories required by approximately 7%. If the decrease in calories from metabolic adaptation and weight loss are additive, it may be possible to achieve 23% CR at the BMI of 20 suggested by Dr. Walford. At the minimum of the normal range, which corresponds to a BMI of 18.5, the calories required decrease by about 15%. Thus, the practical limit of calorie restriction started in adulthood for humans may be around 30% taking into consideration the combined effect of metabolic adaptation and relatively lower body weight.
Mathematical Analysis
The empirical observation of the equivalence between relative body weight and relative BMR or CR for
humans and mice can be justified
by proving that the equation for the rodent experiments can be derived from the Mifflin-St Jeor equations.
Let us start by creating an equation for weight starting from the male BMR equation where the height
has been substituted using the formula with a BMI value of 22.
BMR = 10×weight + 6.25×√ weight/22 - 5×age + 5Let B=BMR, W=weight and A=5-5×age. We take the square root term to one side:
B = 10W + 6.25√ W/22 + AFlipping the equation and squaring both sides we get:
B = 10W + 1.33√ W + A
B-10W-A = 1.33√ W
1.78W = (B-10W-A)2Multiplying out the right side we get:
1.78W = B2 +100W2 -20WB -2BA +20WA +A2We then collect the terms to create a quadratic equation:
100W2 +20WA -20WB -1.78W + B2 -2BA + A2 = 0We solve for W using the quadratic formula:
100W2 + (-20(B-A) - 1.78)W + (B-A)2 = 0
W = [(20(B-A) + 1.78) ± √ (-20(B-A) - 1.78)2 - 400(B-A)2 ]/200Multiplying out the expressions under the radical symbol, 400(B-A)2 cancels out and we are left with:
W = [(20(B-A) + 1.78) ± √ 71.2(B-A)+3.17 ]/200
Considering that B, the BMR, will be a number ranging from 1200 to 1900, corresponding to a 5-foot 92 pound male and a 6-foot 204 pound male, respectively, at age 35, and that the variable A, which is 5-5×age, will be a negative number from -95 to -395 (corresponding to ages 20 to 80), we can estimate that B-A will range from 1295 to 2295. Therefore, the term within the radical will have a range from 92,207 to 163,407, and the square roots of these two numbers are: 304 and 404, respectively.
The portion corresponding to 1.78 + 20(B-A) will range from 25,901.78 to 45,901.78 for the two values of B-A given above. The relative size of the terms on the left of the plus/minus sign will always be much bigger than the values of the square roots. Since the square root term will have a value of approximately one percent of the value on the left side, for all practical purposes the square root term can be ignored, and we have:
W ≅ [1.78 + 20(B-A)]/200Replacing A with 5-5×age, the formula for weight is:
W = (1.78 +20(B-5+5age))/200Since 1.78/200 is small:
W = 0.1B - 0.5 + 0.5ageThe ratio of two weights for the same age is then
Wi/W0 = (0.1Bi -0.5 +0.5age)/(0.1B0 -0.5 +0.5age)Multiplying the numerator and denominator by 2 we get:
Wi/W0 = (0.2Bi -1+age)/(0.2B0 -1+age)Adding and subtracting 0.2B0 from the numerator of the right hand side we get
Wi/W0 = 1 - (B0 - Bi)/(B0 -5+5age)
The equation is already in the form similar to the one derived from the mouse data, and we can recognize that (B0-Bi)/(B0) is equivalent to the term for Calorie Restriction if B0 is the calorie consumption of the control and Bi the consumption of the restricted animal. Taking into consideration the approximations made in the derivation and the other factors in the denominator, the weight ratio equation can be represented with a constant k as follows:
Wi/W0 = 1 - k(B0-Bi)/(B0)
Wi/W0 = 1 - k × CR
Acknowledgement
Martin R. Knight contributed to the mathematical analysis.[8]

