 Index
Index

The elliptical shape of the Carolina Bays with raised rims distinguishes the bays from structures created by wind and water processes. The width-to-length ratio and the eccentricity of the elliptical Carolina Bays have very consistent values for bays of different sizes. The width-to-length ratios of Carolina Bays average 0.58, and the eccentricity averages 0.81. The bays in Nebraska are indistinguishable from the bays in the East Coast on the basis of their geometrical characteristics.
The consistent width-to-length ratios of the elliptical Carolina Bays can be explained if the bays were originally conic sections formed by impacts that created oblique conical cavities. The width-to-length ratios of the bays are related to the angle of impact by the relationship: \( sin(\theta) = W / L \). The angle of impact for Carolina Bays averages 35 degrees. Terrestrial processes by wind and water do not provide a mechanism for stopping when the correct width-to-length ratio is achieved.
The following table has the coordinates and sizes of 23 Carolina Bays. The bays have clearly defined borders that make it possible to measure the major and minor axes accurately using Google Earth with a LiDAR overlay. The eccentricity of an ellipse is given by: \( e = \sqrt{1 - (b^2 / a^2)} \), where \(a\) is the length of its semi-major axis and \(b\) is the length of its semi-minor axis.
| Tag | Latitude | Longitude |
Major axis in meters (L) |
Minor axis in meters (W) |
W/L | Eccentricity |
arcsin(W/L) degrees |
|---|---|---|---|---|---|---|---|
| az0001 | 34.372438 | -79.955112 | 2875 | 1582 | 0.5503 | 0.8350 | 33.38 |
| az0002 | 34.355453 | -79.897354 | 1142 | 627 | 0.5490 | 0.8358 | 33.30 |
| az0003 | 34.348281 | -79.885369 | 829 | 509 | 0.6140 | 0.7893 | 37.88 |
| az0004 | 34.351854 | -79.839793 | 1193 | 756 | 0.6337 | 0.7736 | 39.32 |
| az0005 | 34.341673 | -79.805336 | 2773 | 1505 | 0.5427 | 0.8399 | 32.87 |
| az0006 | 34.354419 | -79.792716 | 1234 | 812 | 0.6580 | 0.7530 | 41.15 |
| az0007 | 34.281692 | -79.769796 | 2406 | 1362 | 0.5661 | 0.8243 | 34.48 |
| az0008 | 34.457433 | -79.914511 | 1438 | 752 | 0.5229 | 0.8524 | 31.53 |
| az0009 | 34.437885 | -79.876300 | 519 | 281 | 0.5414 | 0.8407 | 32.78 |
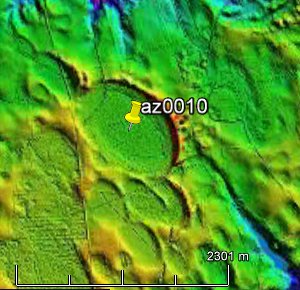
| az0010 | 34.387512 | -79.831597 | 1216 | 780 | 0.6414 | 0.7672 | 39.90 |
| az0011 | 34.516371 | -79.685701 | 2013 | 1208 | 0.6001 | 0.7999 | 36.88 |
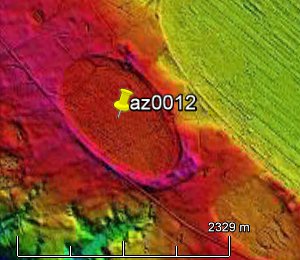
| az0012 | 34.388400 | -79.582470 | 1550 | 890 | 0.5742 | 0.8187 | 35.04 |
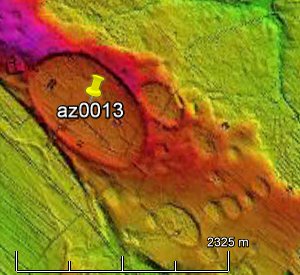
| az0013 | 34.384065 | -79.524621 | 1478 | 867 | 0.5866 | 0.8099 | 35.92 |
| az0014 | 34.526274 | -79.531788 | 1302 | 777 | 0.5968 | 0.8024 | 36.64 |
| az0015 | 34.527690 | -79.485771 | 3125 | 1765 | 0.5648 | 0.8252 | 34.39 |
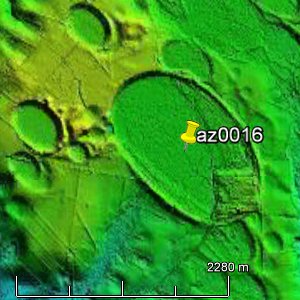
| az0016 | 34.623532 | -79.579738 | 1848 | 1107 | 0.5990 | 0.8007 | 36.80 |
| az0017 | 34.644750 | -79.637077 | 1422 | 871 | 0.6125 | 0.7905 | 37.77 |
| az0018 | 40.516923 | -98.031921 | 5282 | 2854 | 0.5403 | 0.8415 | 32.71 |
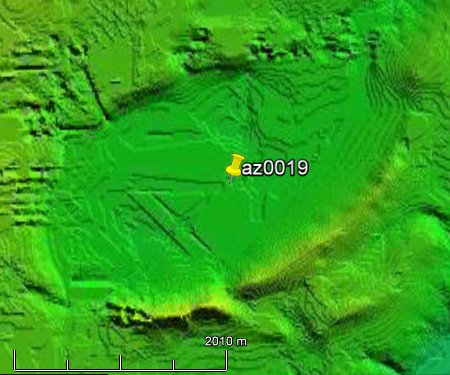
| az0019 | 40.566439 | -98.166159 | 3627 | 1940 | 0.5349 | 0.8449 | 32.34 |
| az0020 | 40.436968 | -97.976410 | 1490 | 990 | 0.6644 | 0.7474 | 41.64 |
| az0021 | 40.518205 | -99.135957 | 2496 | 1210 | 0.4848 | 0.8746 | 29.00 |
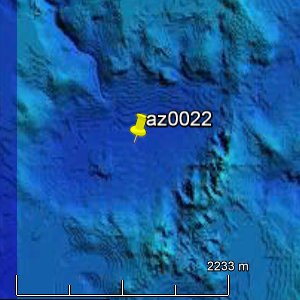
| az0022 | 40.425091 | -98.985710 | 2150 | 1200 | 0.5581 | 0.8297 | 33.93 |
| az0023 | 40.763450 | -97.927499 | 2660 | 1570 | 0.5902 | 0.8072 | 36.17 |
| Average | 0.5794 | 0.8132 | 35.847 | ||||
| Sample Standard Deviation | 0.0452 | 0.0326 | 3.19 | ||||

The tags in the images correspond to the table above.

|

|

|

|

|

|
|

|
|
|

|

|
|

|

|
|

|

|
|

|
The following images show a USGS topograpic map and a LiDAR image of Big Bay, a Carolina Bay just north of Pinewood, SC. The center of the bay is located at approximately Lat. 33.78645, Lon. -80.46785, and the bay measures 4,920 by 3,100 meters. This gives it a width-to-length ratio of 0.63 and an eccentricity of 0.78.
The small bay adjacent to the north-east of Big Bay with a center located at Lat. 33.801219, Lon. -80.450795 measures 1710 meters by 1120 meters. This corresponds to a width-to-length ratio of 0.66 and an eccentricity of 0.76. Both Big Bay and its companion have values close to the average for Carolina Bays.


According to Brooks (2010), the Carolina Bays evolved as a result of processes active episodically over a long period of time. Based on 45 Optically Stimulated Luminescence (OSL) dates, active shorelines and associated eolian deposition occurred during Marine Isotope Stage (MIS) 2 to late MIS 3 (~12 to 50 ka), MIS 4 to very late MIS 5 (60-80 ka), and late MIS 6 (120–140 ka).
Brooks states that Big Bay formed from wind-driven sand sheets from the Wateree River, which is 10 kilometers to the west. The sand moved across Big Bay about 74,000 years ago and was resurfaced subsequently 33,000 to 29,000 years ago. The innermost sand rim at Big Bay was remodeled as recently as 2,200 years before the present.
The paper by Brooks does not mention the consistent width-to-length ratios of the Carolina Bays and does not propose a mechanism for how the wind and water processes could have given Big Bay the typical aspect ratio of the other bays.

